In mass production, it is common practice to consider the trade-off between assembly tolerance/quality and manufacturing capability/cost (see Fig. 1). The concept of tolerance design help assigning appropriate tolerance values with reasonable manufacturing cost meanwhile achieving the desired overall performance. This tool is also useful to analyze function anomaly and re-adjust origianl tolerance values.

Fig. 1 Schematic drawing of trade-off between cost and performance
With regard to purposes, tolerance design can be further categorized into tolerance analysis and tolerance allocation. The difference between the two is illustrated as Fig. 2. In tolerance analysis, the component tolerances are known and the assembly variation is calculated. On the other hand, in tolerance allocation the assembly tolerance is known from design requirements whereas the component tolerance values which meet these requirements are to be determined.

Fig. 2 Difference between tolerance analysis and tolerance allocation
The most basic tolerance analysis approach is worse case (WC) method. The hypothesis is that the assembly variation is the sum of individual component tolerance values. Note that though the assembly acceptance fraction will be 100% and no inteference occur, this may lead to over-design, that is, preserved assembly gap may be too large and produce unacceptable gap or malfunction.
Another common approach is root sum square (RSS) method. It assumes the dimension distribution of each component is normal, which is usually the case in mass production. With such assumption, the assembly variation turns out to be the root sum square value of component tolerance values. The assembly acceptance fraction is then determined by the distribution of components.
Monte-Carlo simulation provides a more flexible tool for tolerance analysis. It is an experiment performed on a computer, studying system performance by considering possible values of the tolerance, each following a specific distribution pattern. Not only can this approach be applied to combination of different distributions, but also can it be extended to nonlinear tolerance analysis, for example, the resistance of 2 resistors in parallel. These three methods, WC, RSS, and Monte-Carlo are depicted in Fig. 3.


Fig. 3 Demonstration of 3 different tolerance analysis methods
In most cases, engineers are more commonly faced with the problem of tolerance allocation rather than tolerance analysis. The designer begins by assigning reasonable component tolerances based on process or design guidelines. And, if the specified assembly tolerance is not met, component tolerance can be scaled by a proportionality factor. This approach is called proportional scaling and the relative magnitudes of the component tolerances are preserved. This algorithm is illustrated by a 2 component assembly scenario in Fig. 4, where both worse case and RSS statistical limits are shown. By drawing a line from the origin through original tolerances point, one can obtain the intersection points with both limits, and the proportionality factors, limit point values over original tolerance point, can then be calculated accordingly. Pre-multiplying each component tolerance by the scaling factors will ensure assembly requirements of different limits.

Fig. 4 Proportional scaling of a 2-component assembly system

Fig. 5 Re-allocation of a 2-component assembly system by weight factors
Another practical method accommodates least cost optimization. This is accomplished by defining a cost versus tolerance curve for each component in the assembly. Many cost versus tolerance models have been proposed, and yet little have been done to verify since manufacturing cost data are so site-dependent. Nevertheless, the spirit of the optimization scheme is to vary the tolerance for each component and search systematically for the combination of tolerances which minimizes the cost. This is well illustrated in Fig. 6, where minimum cost is achieve at the tangent point of tolerance limit and the constant cost curve.
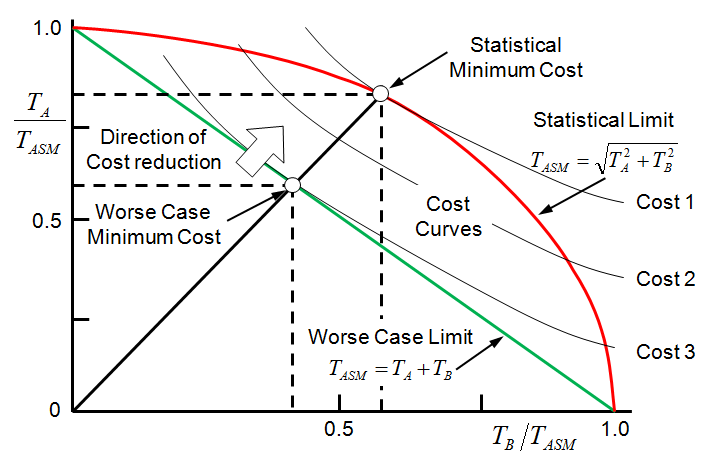
Fig. 6 Minimum cost optimization of a 2-component assembly system
No comments:
New comments are not allowed.